NFL QB Season Stats — Pre-sorted by Passing Yards (Core Column)
The table below lists games played, passing yards, touchdowns, completion percentage, interceptions, and sacks taken. It is pre-sorted by Passing Yards to compare volume first. Hover over a row to highlight it. The Passing Yards cell in that row gets an extra spotlight. Click a QB name to build a one-line summary in the message box.
| QB Name
Click a name to send a quick summary to the box below.
|
Games Played
Number of games appeared in.
|
Passing Yards
Total yards through the air (core column).
|
Touchdowns | Completion % | Interceptions | Sacks Taken |
|---|---|---|---|---|---|---|
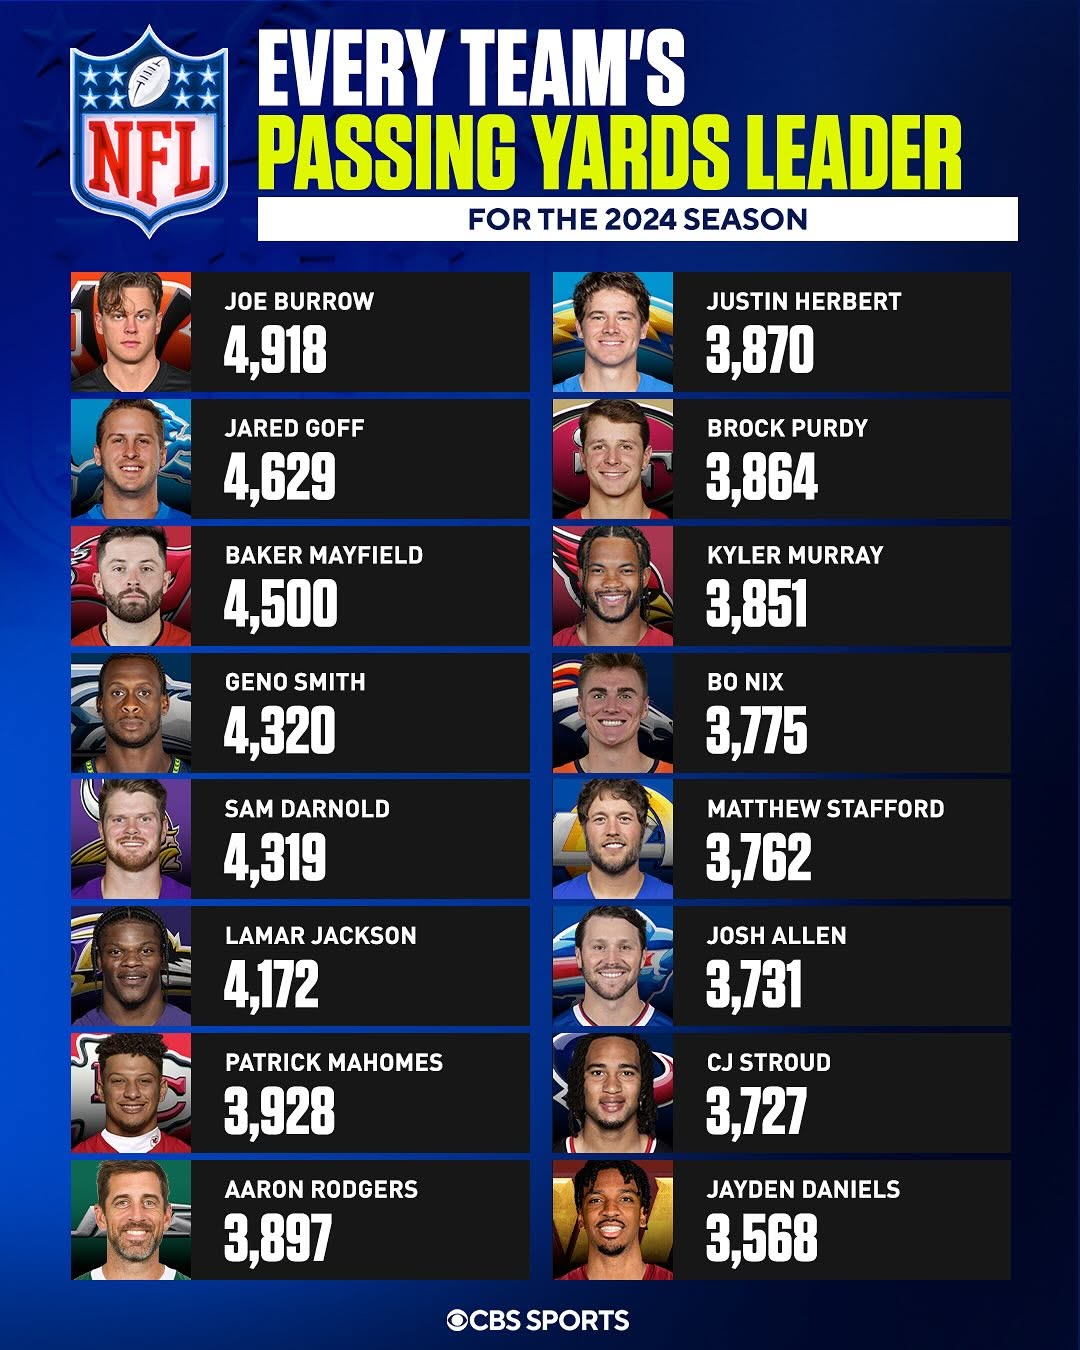
| Joe Burrow | 17 | 4918 | 43 | 70.6 | 9 | 48 |
| Jared Goff | 17 | 4629 | 37 | 72.4 | 12 | 31 |
| Baker Mayfield | 17 | 4500 | 41 | 71.4 | 16 | 40 |
| Geno Smith | 17 | 4320 | 21 | 70.4 | 15 | 50 |
| Sam Darnold | 17 | 4319 | 35 | 66.2 | 12 | 48 |
| Lamar Jackson | 17 | 4172 | 41 | 66.7 | 4 | 23 |
| Patrick Mahomes | 16 | 3928 | 26 | 67.5 | 11 | 36 |
| Aaron Rodgers | 17 | 3897 | 28 | 66.8 | 11 | 40 |
| Justin Herbert | 17 | 3870 | 23 | 65.9 | 3 | 41 |
| Brock Purdy | 15 | 3864 | 20 | 65.9 | 12 | 31 |
| Kyler Murray | 17 | 3851 | 21 | 68.8 | 11 | 30 |
| Bo Nix | 17 | 3775 | 29 | 66.3 | 12 | 24 |
| Matthew Stafford | 16 | 3762 | 20 | 65.8 | 8 | 28 |
| Josh Allen | 17 | 3731 | 28 | 63.6 | 6 | 14 |
| CJ Stroud | 17 | 3727 | 20 | 63.2 | 12 | 52 |
Walkthrough
Example 1: Highlight Joe Burrow and build a summary.
Example 2: Spotlight Jared Goff’s yardage and show a header tip.
Subset: Top 5 Yardage Leaders — Efficiency Check
This mini-table pulls the five highest yardage QBs from the main grid and adds a simple TD/INT ratio to show efficiency alongside volume.
| Player | Passing Yards | TD | INT | TD/INT | Completion % |
|---|---|---|---|---|---|
| Joe Burrow | 4918 | 43 | 9 | 4.8 | 70.6 |
| Jared Goff | 4629 | 37 | 12 | 3.1 | 72.4 |
| Baker Mayfield | 4500 | 41 | 16 | 2.6 | 71.4 |
| Geno Smith | 4320 | 21 | 15 | 1.4 | 70.4 |
| Sam Darnold | 4319 | 35 | 12 | 2.9 | 66.2 |
What it shows: Burrow pairs the most yards with the best TD/INT (4.8), but he also took 48 sacks in the full table, which hints at pressure and risk. Goff’s 72.4% completion is the best among these leaders and his 3.1 TD/INT is strong. Mayfield’s volume is high, but his 2.6 ratio trails Goff and Darnold. Geno’s 1.4 ratio shows that volume alone does not equal efficiency. For comparing top producers, you should weigh yardage alongside TD/INT and completion percentage.
Quick Analysis
Looking at the top 3 QB's that led the NFL in passing yards last year, some trends can be established. Starting off, all 3 QB's played in all 17 games of the standard NFL season. They also had some of the highest completion percentages, and touchdowns thrown. From these trends we can establish the fact that these QB's either had solid team support, or are genuinely some of the best at their position. But despite these three QB's had some of the best statistics this last season, they all still failed to make the Super Bowl. This could be due to a variety of factors, such as defense, special teams, or coaching. But from these results we can make the conclusin that football is truly a team sport, because even though all these QB's were high preforming they still struggled making the suberbowl, and statistically the best QB didn't even make the playoffs.
Glossary
- Passing Yards
- Total yards gained through completed passes.
- Completion Percentage
- Completions divided by attempts.
- Touchdowns (TD)
- Number of passing touchdowns.
- Interceptions (INT)
- Passes caught by the defense.
- Sacks Taken
- Times the QB was tackled behind the line on a pass play.