NFL QB Performance Trends
Looking at the top 3 QB's that led the NFL in passing yards last year, some trends can be established. Starting off, all 3 QB's played in all 17 games of the standard NFL season. They also had some of the highest completion percentages, and touchdowns thrown. From these trends we can establish the fact that these QB's either had solid team support, or are genuinely some of the best at their position. But despite these three QB's had some of the best statistics this last season, they all still failed to make the Super Bowl. This could be due to a variety of factors, such as defense, special teams, or coaching. But from these results we can make the conclusin that football is truly a team sport, because even though all these QB's were high preforming they still struggled making the suberbowl, and statistically the best QB didn't even make the playoffs.

Sports Car Practical Value Analysis
If you need more space or long-trip comfort: Best practical value: Ford Mustang Convertible. You pay more than the Miata, but you gain four seats, better utility, and still keep a strong fun factor. No score is under 7.0, which makes it easy to live with. Luxury GT choice: Mercedes SL for comfort and tech, with average value. Flagship thrill: Porsche 911 and BMW M8 are amazing, yet their value scores and six-figure prices show steep diminishing returns compared to the Miata. Recommendation: Buy the 2025 Mazda MX-5 Miata RF if pure value is the goal. It delivers the highest driving score at the lowest transaction price in this set, the best MPG score, and a high special factor. If you need four seats, choose the Ford Mustang Convertible as the practical value pick.

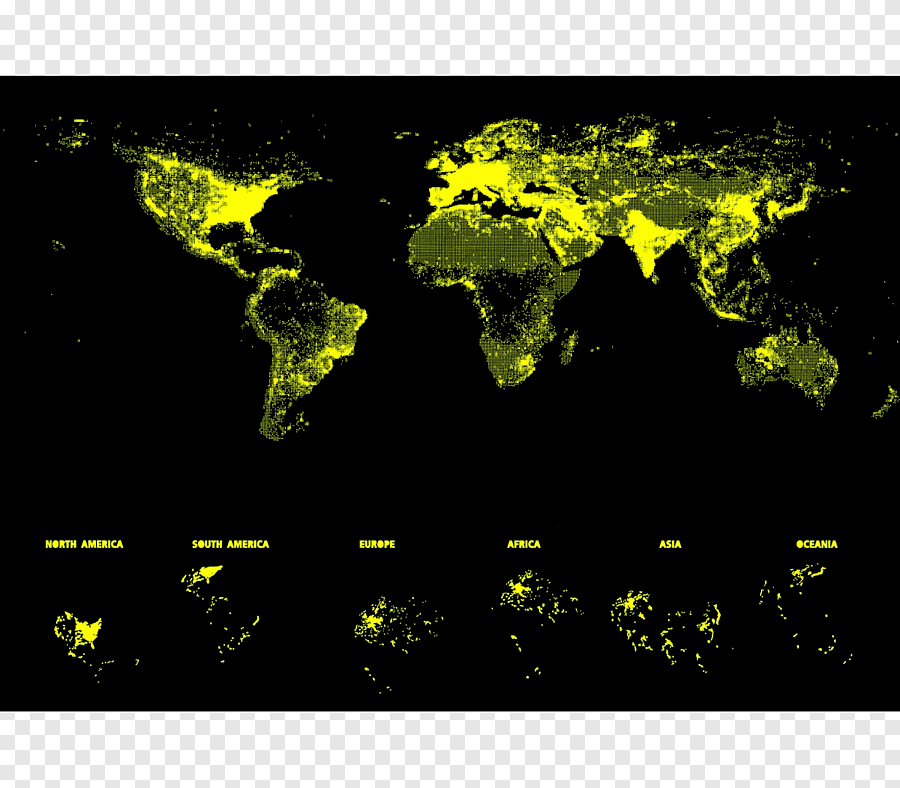
Irvine Light Pollution Analysis
A recent analysis of Irvine’s light pollution levels reveals that the city’s night sky is over 40% brighter than natural conditions, placing it among the most light-polluted regions globally—comparable to New York, London, and Tokyo, and worse than San Francisco or San Diego (DarkSky International). This excess brightness represents not only environmental degradation but also significant energy inefficiency, with an estimated 30% of outdoor lighting wasted, directly translating to higher emissions and costs. In contrast, nearby San Clemente records only a 10% increase above natural sky brightness, demonstrating that regional improvement is achievable through targeted interventions. Our field observations further found that many of Irvine’s streetlights use bluish-white LEDs exceeding 5000 K, which emit higher levels of short-wavelength light known to intensify skyglow and disrupt circadian rhythms. Transitioning to full-cutoff fixtures and warmer LEDs (≤3000 K) would significantly reduce light scatter, preserve nocturnal visibility, and maintain public safety. Together, these findings illustrate that Irvine can cut light pollution by more than half through data-backed, design-driven infrastructure changes—positioning the city as a model for sustainable urban lighting reform.
CO₂ Capture: DAC vs. PSC
A comparative data analysis between Direct Air Capture (DAC) and Point Source Capture (PSC) demonstrates that PSC is significantly more energy- and cost-efficient for large-scale CO₂ reduction. Thermodynamic modeling using the Peng–Robinson equation of state shows that PSC requires only 5.10×10³ m³ of air to capture 1 kg of CO₂, compared to 5.12×10⁴ m³ for DAC—a tenfold decrease in air volume and corresponding reduction in energy demand. This difference translates into an energy use of roughly 80–130 kWh per ton of CO₂ for PSC, versus over 4000 MWh per day for DAC systems such as those operated by Carbon Engineering. When accounting for material and utility costs—including solar power at $30–60 per MWh, water losses of 57.5 t/h, and limestone inputs—DAC’s Levelized Cost of Carbon rises to $128.9–195.3 per ton, while PSC averages near $80 per ton. These data underscore PSC’s superior thermodynamic and economic performance, revealing that reallocating current DAC investments toward PSC could yield up to a 2.5× improvement in CO₂ capture cost-efficiency across industrial and power sectors.
